People are fast-scrollers and we only read a fraction of what we see on the page. Many people do not read long blocks of text. That is where infographics are valuable.
Infographics present information in a visual way, which makes it easier to scan and recall. Instead of reading long paragraphs or texts, they can quickly understand the main takeaways from charts, icons and the layout. As a result, infographics are a powerful communication tool nowadays.
Corporations use infographics to present reports and presentations. Marketing teams use them to promote products and services on social media. Teachers use them to teach complex subjects. The aim is always the same: to present information more clearly and engagingly.
But finding the right infographic generator can be tricky.
Some are designed for rapid designs. Others help you create data visuals, reports, or interactive pieces. Some tools use AI features, while others keep it simple and easy to use. The wrong tool can hinder your progress or output.
That is why we have put together the best infographic maker tools in this guide. We will compare each tool based on features, ease of use, cost and use cases.
At the end, you will know where to make an infographic, how different tools stack up, and what actually works depending on your workflow.
Top Infographic Makers for Your Next Project
| Tool | Data Handling & Import Options | Branding & Accessibility | AI Features & Smart Tools | Ease of Use for Beginners | Best For |
| Venngage | High (data-first templates, charts, maps) | High (Brand Kit, structured layouts) | Medium (template-driven, less AI-heavy) | High | Business reports, client presentations, and marketing teams |
| Canva | Medium (basic charts, simple workflows) | Medium-High (strong Brand Hub) | High (Magic Write, AI tools) | High | Quick designs, social media, and beginners |
| Visme | High (Excel/Sheets import, 50+ charts) | High (Brand Kit, enterprise-ready) | High (AI tools, interactivity, animation) | Medium-High | Interactive infographics, data storytelling, and presentations |
| Piktochart | High (CSV, Google Sheets sync) | Medium (Brand Kit paywalled) | High (AI generator, AI outline) | Medium-High | Reports, dashboards, structured data visuals |
| Infogram | High (live data, SQL, APIs) | Medium-High (business-focused structure) | High (AI charts, auto-layout) | Medium-High | Data visualization, analytics dashboards |
| Easel.ly | Low-Medium (basic static charts) | Low-Medium (limited branding tools) | Low (minimal AI features) | High | Students, educators, and simple infographics |
| Animaker | Low-Medium (basic animated charts) | Medium (basic branding) | Medium-High (animation + video tools) | Medium | Animated infographics, explainer videos |
| Snappa | Low (no real data tools) | Low-Medium (basic branding) | Low (minimal AI) | High | Social media graphics, quick visuals |
| VistaCreate | Medium (basic charts, visual-first) | Medium (Brand Kit included) | High (AI images, animation) | High | Creative, animated infographics, branding |
| Adobe Express | Medium (simple data handling) | High (Adobe branding ecosystem) | High (AI templates, Firefly) | High | Branded content, agencies, Adobe users |
| Genially | Medium (basic charts + interactivity) | Medium-High (Brand Kit, presentation-ready) | High (interactive + AI text tools) | Medium-High | Interactive infographics, education, and presentations |
| DesignCap | Medium (statistical layouts, no live data import) | Medium (basic branding) | Low-Medium (modular design, limited AI) | High | KPI reports, statistical infographics |
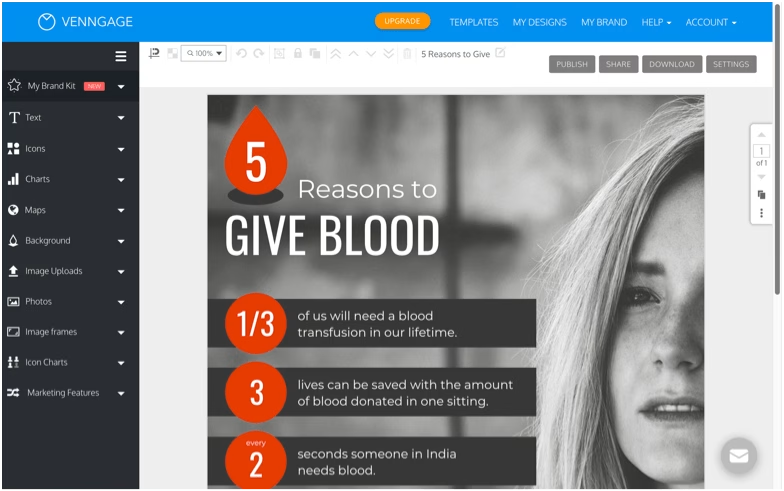
Venngage Infographic Maker – Best for Business Infographics & Reports
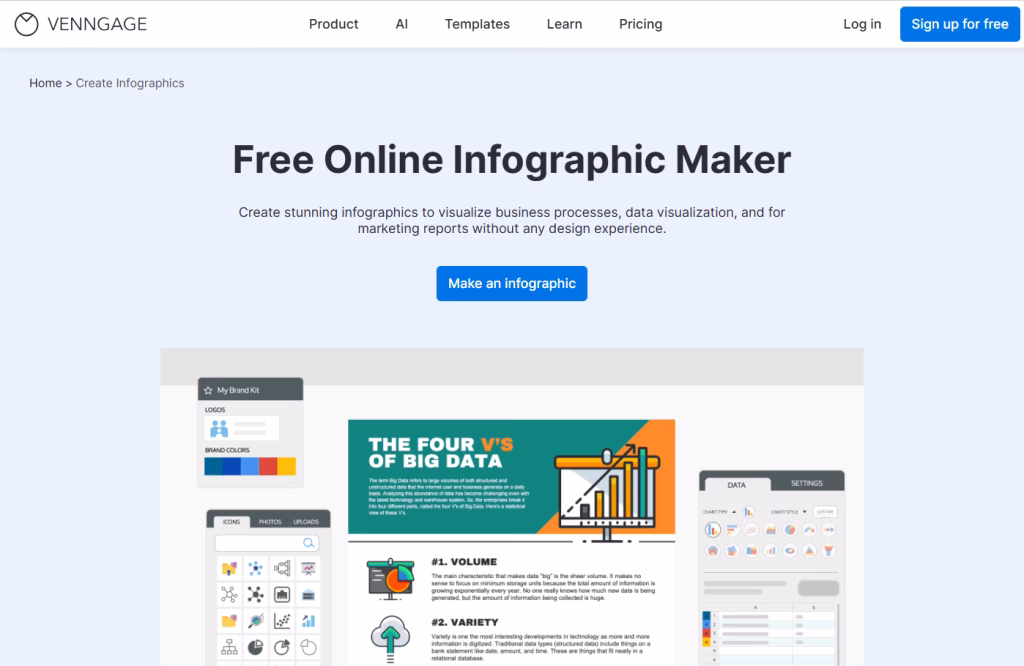
Venngage is an infographic design maker for designing data-driven visuals. It is particularly suited to businesses, marketers, and agencies that need well-organized designs for reports, presentations, or clients.
Rather than starting with a blank page, Venngage offers pre-designed infographic templates according to your needs and goals. You can easily make an infographic from data, such as charts, timelines, and comparisons, without having a design background. It is easy to use and produces high-quality, consistent results.
Main Features
- Wide Range of Infographic Templates: Select from statistical, timeline, process, comparison, and geographical infographics. Each layout is tailored to the purpose, saving you time.
- Built-In Data Visualization Widgets: Insert charts, maps, diagrams, and graphs in your designs. This makes it easier to communicate and organize data effectively.
- Brand Kit for Consistency: Use brand colors, fonts, and other styles. This is helpful for companies needing branding.
- Drag-and-Drop Editor: The editor is easy to use. You can easily edit layouts, text, and images without code.
- Collaborative Editing: Collaborate with team members in real time, track changes, and review and approve content.
Advantages
- Easy-to-understand user interface and quick to learn
- Emphasizes data analysis and business applications
- Provides templates for quicker designs
- Easy to create consistent branding
- Good collaboration features for teams
Limitations
- The free plan offers limited templates and export options
- Advanced features are available in higher-tier plans
- Less design flexibility and options
- Some template designs feel repetitive after heavy use
Why Choose Venngage?
Venngage is different because it emphasizes clarity and structure. It is designed to help people communicate, not just draw pictures or visuals.
It helps you visualize data to quickly communicate ideas. So it is good for reports, presentations and marketing when you need to communicate information clearly and accurately.
Pricing
- Free Plan – Basic access with limited features
- Premium Plan – Starts around $10–$19/month
- Business Plan – Starts around $24–$49/month
- Enterprise Plan – Custom pricing
- Education Plans – Around $29/month for classrooms
- Nonprofits – Up to 50% discount
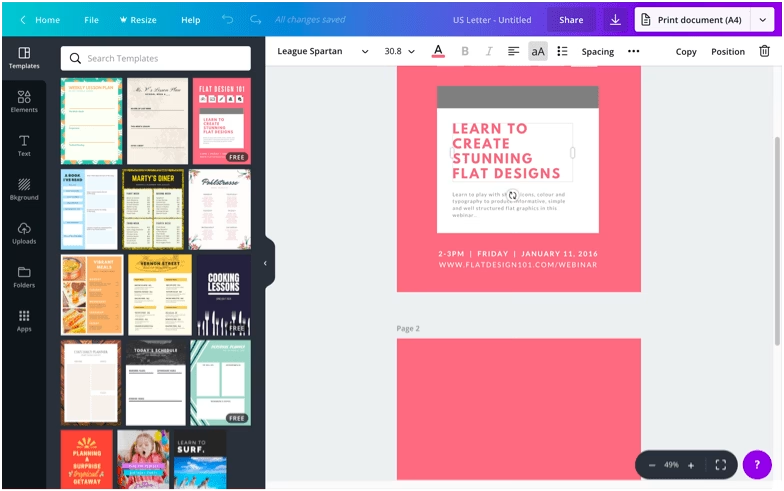
Canva Infographic Maker – AI-Powered Tool for Quick Visual Designs
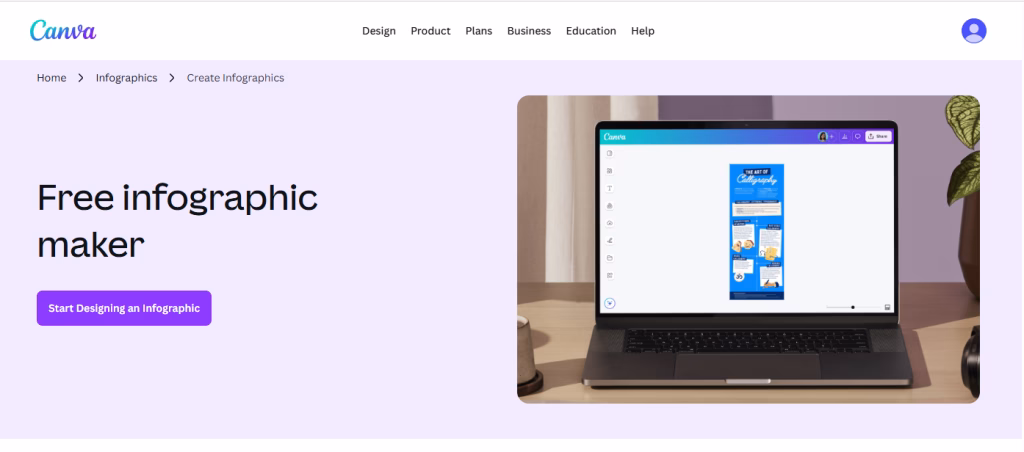
Canva is one of the most accessible online infographic makers with an easy-to-use interface and quick design options. It enables you to turn text into visuals, with features such as Magic Write and smart design tips to make.
It can be used without signing up, which removes friction early on. Once logged in, there are thousands of infographic templates for marketing, education, and social media.
Canva is great for individual users, but it also has team collaboration and branding features. Its simplicity and versatility make it so appealing.
Main Features
- AI Content Generation (Magic Write): Write, summarize, or expand text for infographics with AI. This can assist in the content creation process.
- Massive Template Library: Canva offers thousands of infographic templates, including timelines, lists, comparisons, and reports.
- Thousands of Media Assets: Get access to millions of icons, photos, illustrations, and other graphics. You can also upload your own media.
- Drag-and-Drop Editor: The editor is user-friendly and intuitive. It is easy to drag, drop, and edit elements.
- Collaborate in Real-Time: Multiple users can edit designs together.
- Brand Hub (Pro): Save your brand colors, fonts, and logos for consistent design across the board.
Advantages
- Very easy to use, even for beginners
- Large collection of templates and design elements
- Fast infographic creation with drag-and-drop tools
- Works across devices (desktop, mobile, browser)
- Strong collaboration features for teams
Limitations
- Free plan includes watermarks on some designs
- Premium templates and assets require a paid plan
- Data visualization tools are basic compared to advanced tools
- Finding fully customizable icons can take time
Why Choose Canva?
Canva excels in simplicity. It does not try to overwhelm users with advanced AI design tools. Instead, it focuses on speed and accessibility.
The free AI infographic maker tool makes it easy to go from idea to finished infographic in a short time. This is why it is a top choice for marketers, writers, and smaller teams looking for simple, fast visuals without a complex learning curve.
Pricing
- Free Plan – Basic templates and features
- Canva Pro – Starts at ~$12.99–$15/month per user
- Canva for Teams – Starts at ~$20/month per user
- Enterprise Plan – Custom pricing
Free users can still create infographics, but premium plans unlock better templates, brand tools, and export options.
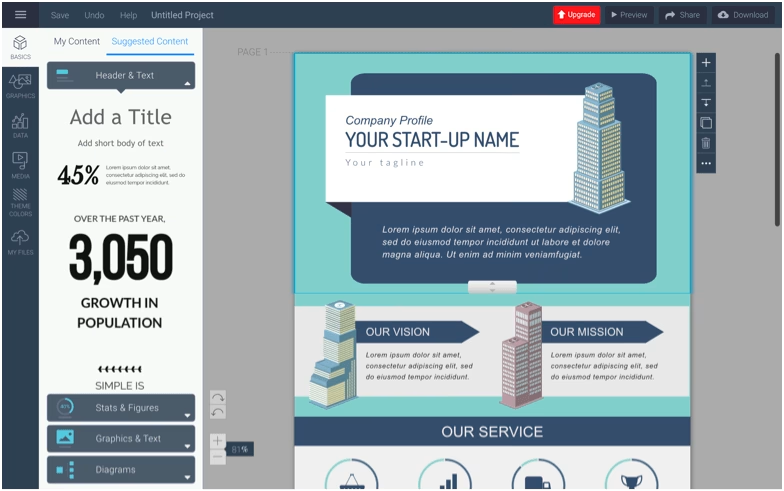
Visme Infographic Maker – All-in-One Tool for Interactive & Data-Driven Designs
Visme is an infographic design maker that is more than just a simple visual tool. It allows you to create infographics, presentations, reports, videos, and more.
What stands out early is how easy it is to use. The drag-and-drop editor is intuitive; once a template is chosen, most infographics can be created in minutes. However, Visme offers more control over content blocks, animations, and interactions, making it suitable for more intricate graphics.
You can design from scratch or select from hundreds of infographic templates, including informational, business, timeline, comparison, geographic, and reports. This makes it great for both simple and complex, data-rich visuals.
Main Features
- Huge Template Library: Visme has hundreds of infographic templates, including process, timeline, reports, business, and marketing. Templates are easy to search and customize.
- Data Visualization: Offers charts, graphs, tables, flowcharts, maps, and data widgets. Data can be imported from Google Sheets and Excel, and visuals can be updated automatically.
- Interactive & Animated Infographics: You can create hover effects, clickable elements, pop-ups, hyperlinks, and animations. You can also animate charts with various options.
- Content Block System: Make changes to parts of the infographic without disrupting the whole design. Speeds up editing and prevents layout issues.
- AI Image Generator & AI Text Writer: Use text prompts to create images and AI to generate or edit infographic content. Aids in design and writing.
- Visual Asset Library: Available with millions of stock photos, icons, illustrations, shapes, videos, and animated characters. Assets can be easily edited to fit your design.
- Brand Kit & Design Consistency: Save brand colors, fonts, logos, and templates. Teams can use these assets to maintain consistent branding across projects.
- Collaboration Features: Collaborate with team members in real-time by adding comments, mentions, and feedback.
- Shortcut Command System: Use the “/” command to access elements, charts, icons, and tools.
Advantages
- Easy to start, even for non-designers
- Strong customization options for detailed designs
- One of the best tools for data visualization
- Supports interactive and animated infographics
- Content blocks make editing faster and more flexible
- Works for multiple content types beyond infographics
- Good collaboration features for teams
Limitations
- The free plan has limits on projects and assets
- Advanced features require paid plans
- AI tools assist but do not fully automate complex infographics
- Interface may feel feature-heavy for simple use cases
- Learning curve increases as you explore advanced features
Pricing
- Free Plan – Limited projects and basic features
- Starter Plan – Starts at around $12.25/month (billed yearly)
- Pro Plan – Starts at around $24.75/month with unlimited projects
- Enterprise Plan – Custom pricing for teams
Why Choose Visme?
Visme is both easy and powerful. Other infographic tools are either too simple or too intricate. Visme is not one of these.
You can easily generate an infographic, and, if you want, create interactive infographics with animations, real-time data, and advanced customization. This makes it a great option for those who do not want to use multiple tools.
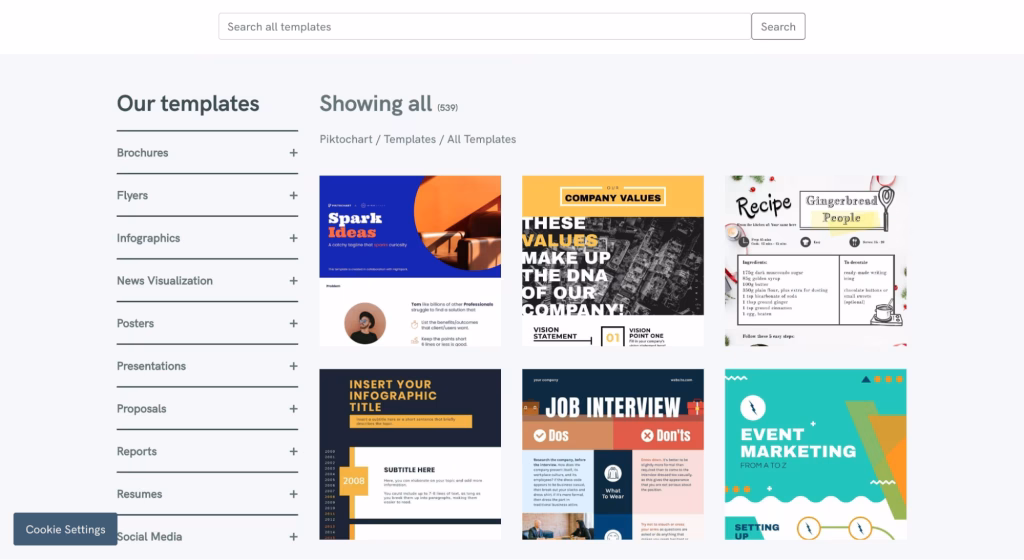
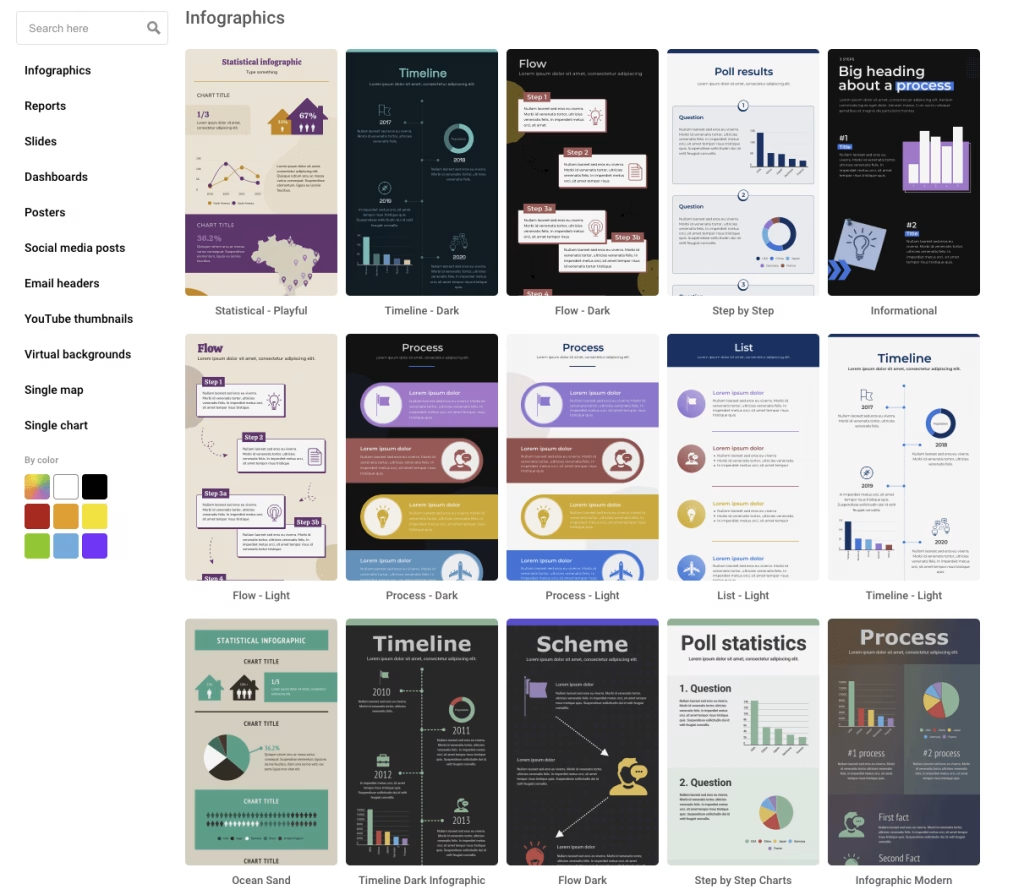
Piktochart Infographic Maker – Best for Data-Driven Infographics & Reports
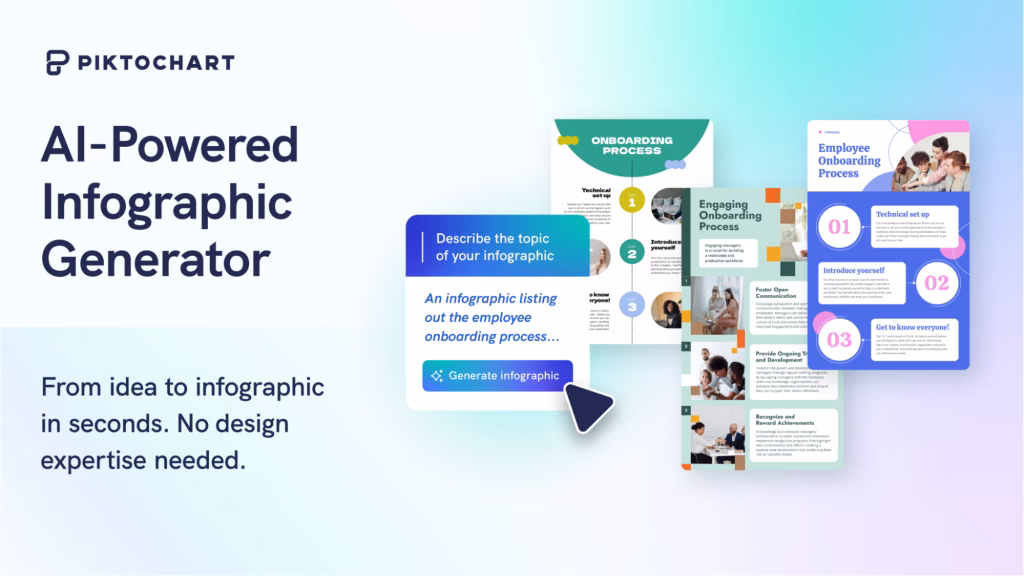
Piktochart is a tool for creating infographics to visualize data. It is particularly helpful for companies, marketers, and teams looking to display reports, dashboards, or data insights in an easy-to-understand way.
The platform now includes an AI infographic maker that can generate designs from text, or paste or upload images. It also has an AI outline tool to help structure your content before you design.
Piktochart designs have very organized and open layouts, sometimes looking like small websites. This makes it a good option for reports, presentations, and website embeds.
Main Features
- AI Infographic Generator: Create infographics from text descriptions or documents. AI designs the layout and structure and generates content.
- AI Content Outline: Generates a structure for your content to organize your infographic.
- 200+ Infographic Templates: Templates for reports, timelines, comparisons, presentations, and marketing.
- Data Visualization Tools: Provides 15+ chart types, maps, radial charts, and hierarchy visuals. Import data from a CSV or Google Sheets file.
- Google Sheets Integration: Sync live data and update your infographics automatically when data changes.
- Content Blocks & Smart Layout System: Edit sections individually using adjustable blocks. Grid lines and smart alignment help maintain clean spacing.
- “Download as Blocks” Feature: Break large infographics into smaller sections for easy sharing on social media.
- AI Image Generator & Enhancer: Generate images and enhance them with background removal, upscaling, and editing features.
- Visual Asset Library: Icons, illustrations, and graphics. Some are editable, but not all.
- Export Options: You can download the design as a PNG, JPG, or PDF, or share a link.
Advantages
- Easy to use with a clean, guided interface
- Strong focus on data visualization and reporting
- AI tools help speed up infographic creation
- Structured templates improve readability
- Google Sheets integration supports real-time updates
- Unique block export feature for content repurposing
Limitations
- Web-based only (no dedicated desktop or mobile app)
- Basic collaboration features compared to competitors
- No built-in analytics or performance tracking
- Limited advanced export formats (no HTML5, SCORM, xAPI)
- Some assets are not fully customizable
- AI-generated designs may feel generic without editing
Pricing
- Free Plan – Basic templates and features
- Pro Plan – Starts at around $14/month per user (billed annually)
- Business Plan – Around $24/month per user with more storage and assets
- Enterprise Plan – Custom pricing
Why Choose Piktochart?
Piktochart focuses on structured communication rather than creative experimentation. It’s built for users who want to present data clearly, not spend hours designing from scratch.
The combination of AI-generated layouts, real-time data integration, and clean templates makes it especially useful for reports, dashboards, and presentations. While it may not offer the same creative flexibility as Canva or the deep interactivity of Visme, it delivers strong results for data-focused visuals.
Infogram – Powerful AI Infographic Maker for Data Visualization

Infogram stands out as one of the best AI infographic generators and data visualization tools, transforming complex datasets into engaging, interactive infographics, charts, reports, and maps.
Whether you are a marketer, data analyst, or business professional, Infogram’s online infographic generator simplifies the process by automatically suggesting layouts, charts, and visuals based on your data or prompts, making it easier than ever to create stunning data-driven content.
Main Features
- Drag-and-Drop Editor: A simple editing interface where elements snap into place, which reduces design errors.
- Built-In Charts & Data Visualization: Supports bar charts, pie charts, maps, and basic data widgets for visual storytelling.
- AI Infographic Generator and AI Chart Recommendations: Enter a topic, prompt, or data, and the AI populates templates with relevant visuals, content, and layouts in seconds.
- Extensive Data Visualization: Over 35+ interactive chart types (including unique options like tree charts and word clouds), 500+ maps, timelines, flowcharts, and diagrams.
- Live Data Integration: Import from CSV, Excel, Google Sheets, and SQL databases, and connect to live sources for real-time updates.
- Interactivity & Animations: Add hover tooltips, scroll effects, animated charts, callouts, and hyperlinks for dynamic user experiences.
- Rich Visual Assets: Access icons from The Noun Project, GIFs and stickers from GIPHY, shapes, and premium templates (with auto-layout for quick adjustments).
- Text & Elements: Custom headings, tables, content blocks, and brand kit support for consistent designs.
- Collaboration & Sharing: Real-time team editing, folder sharing, and easy embedding of interactive HTML visuals on websites or blogs.
- Export Options: High-quality PNG, PDF, GIF, MP4, or interactive embeds, with presenter notes in higher plans.
Advantages
- Perfect for turning statistics, KPIs, research, and analytics into clear, engaging visuals.
- The AI infographic generator and auto-layout significantly reduce design time.
- Animated elements, tooltips, and live data make infographics more engaging than static designs.
- Direct connections to data sources and easy website embeds boost usability for digital marketing and reporting.
- Content looks great across devices and integrates smoothly into blogs or sites.
Limitations
- Fewer illustrations and custom animations compared to general design tools; templates lean heavily toward charts and data.
- Advanced features like premium templates, brand kits, and advanced analytics require paid plans.
- While the interface is user-friendly, mastering advanced interactivity or large datasets takes some practice.
- The free plan limits projects and exports and removes watermarks only upon upgrade.
Pricing
- Basic (Free): Up to 10 projects, 35+ interactive charts, basic maps, and publishing online. Ideal for testing the tool.
- Pro: Starts at $19–$25/month (billed annually). Up to 100 projects, premium templates, data connections, live data, and more.
- Business: Around $67–$79/month. Up to 1,000 projects, brand kit, advanced customization, and tooltip options.
- Team: From $149 to $179/month (starting with 3 users). Real-time collaboration, engagement analytics, and team features.
- Enterprise: Custom pricing for larger organizations with advanced needs.
Why Choose Infrogram?
Instead of focusing purely on charts or heavy data dashboards, Piktochart leans toward structured storytelling through visuals.
It is not trying to compete with analytics-heavy platforms. Instead, it focuses on helping users answer a simpler problem: How to make infographics clearly without overcomplicating the design.
That subtle shift makes it useful for marketing teams, educators, and even students who want clean visuals without spending hours tweaking layouts.
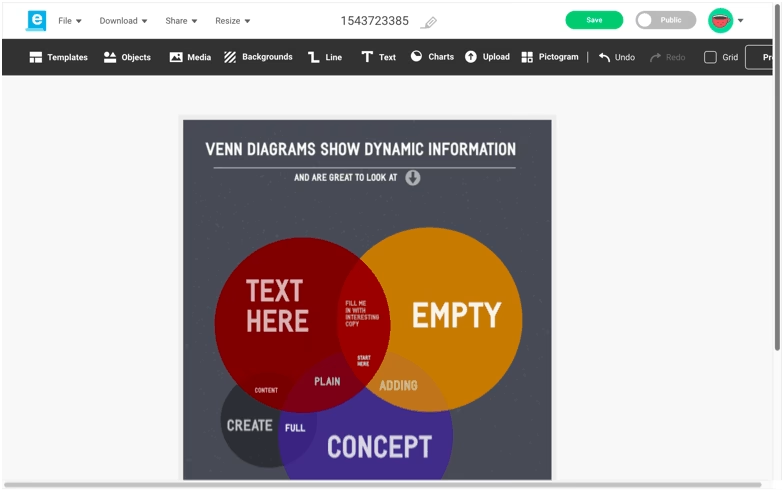
Easel.ly – Simple Infographic Maker for Beginners & Educators
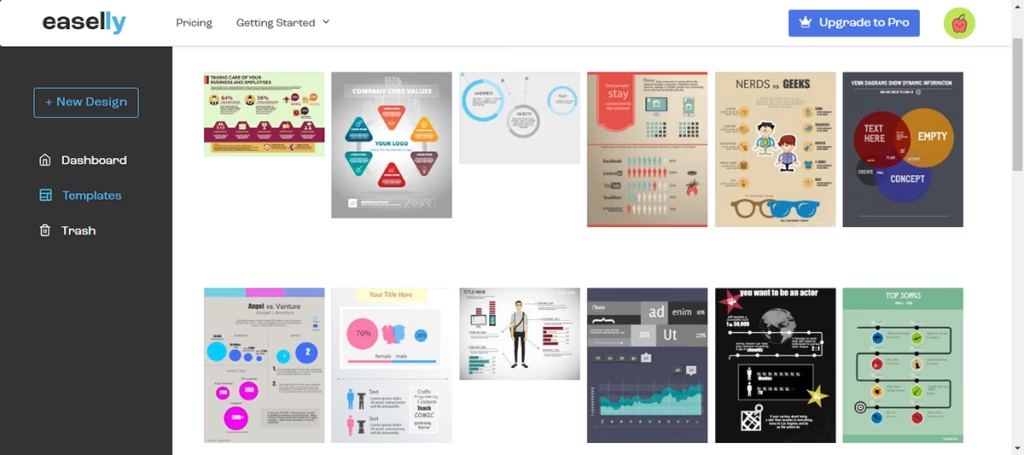
Easel.ly is a simple, free infographic maker and design tool that focuses exclusively on creating beautiful, easy-to-understand infographics, posters, and visual content. With its simple drag-and-drop interface and ready-made templates, Easel.ly serves as an excellent infographic generator for users who want quick results without a steep learning curve or complex features.
Whether you’re a student, teacher, or small business owner, Easel.ly makes it fast and budget-friendly to turn ideas, data, or information into engaging visuals for classrooms, presentations, reports, or basic marketing needs.
Main Features
- Extensive Template Library: Over 1,000 free and premium infographic templates covering timelines, processes, reports, educational topics, and more.
- Rich Visual Assets: Icons, illustrations, photos, shapes, lines, pictograms, and a collection of simple animations to enhance your designs.
- Basic Data Visualization: Easy-to-add static charts and graphs (bar, pie, line, etc.) for simple data storytelling.
- Text & Customization: Flexible text options, bullet lists, and full drag-and-drop editing to personalize layouts, colors, and elements.
- Media Integration: Upload your own images, add YouTube videos, and access a media library for quick additions.
- Export Options: Download in high-quality PNG, JPG, and PDF formats.
- Private Work & Sharing: Create privately (paid plans) and share your finished infographics easily.
- Sandbox Mode (No Sign-Up Required): You can explore and design without creating an account, which lowers the entry barrier.
Advantages
- One of the cheapest dedicated infographic tools available, perfect for budget-conscious users.
- Simple interface. Ideal for non-designers and quick projects.
- Great selection of templates for teaching, learning, workshops, and student assignments.
- Most users can finish a basic infographic in under 30 minutes.
- Drag-and-drop functionality, plus a free design sandbox, let you experiment without signing up.
Limitations
- No live data import, real-time collaboration, or interactive elements like HTML5 embeds.
- Fewer icons, illustrations, and animations compared to full-featured tools like Visme or Infogram.
- Templates have a casual, colorful style that may feel too simple for highly professional or data-heavy corporate designs.
- Lacks advanced AI infographic generation or smart recommendations.
- The free version has restrictions on templates, private projects, and commercial use.
Pricing
- Free Plan — Access to basic templates, limited icons/photos, and public projects. Great for testing and simple personal use.
- Student Plan – Around $2/month
- Individual Plan – Around $4/month (includes additional templates and features)
- Business Plan – Around $5/month (allows commercial use)
- Enterprise Plan – Custom pricing
Why Choose Easel.ly?
Easel.ly stands out for its simplicity and affordability. It does not try to compete with advanced design platforms. Instead, it focuses on making infographic creation accessible for beginners.
The tool works best when you need straightforward visuals without spending much time or money. While it lacks advanced features, its simplicity can actually be an advantage for users who feel overwhelmed by more complex tools.
Animaker – Best Animated Infographic Maker for Dynamic Video Infographics
Animaker is an animated infographic maker and video-based infographic generator that transforms static data into engaging, motion-filled animated infographics and explainer videos. With its playful interface, built-in characters, voiceover tools, and animation effects, Animaker stands out as the go-to animated infographic tool for creators who want to add movement, storytelling, and audio to make complex information more captivating and memorable.
Perfect for turning reports, statistics, or ideas into professional animated infographics, Animaker combines easy drag-and-drop editing with video capabilities, making it ideal for social media, presentations, marketing campaigns, and educational content.
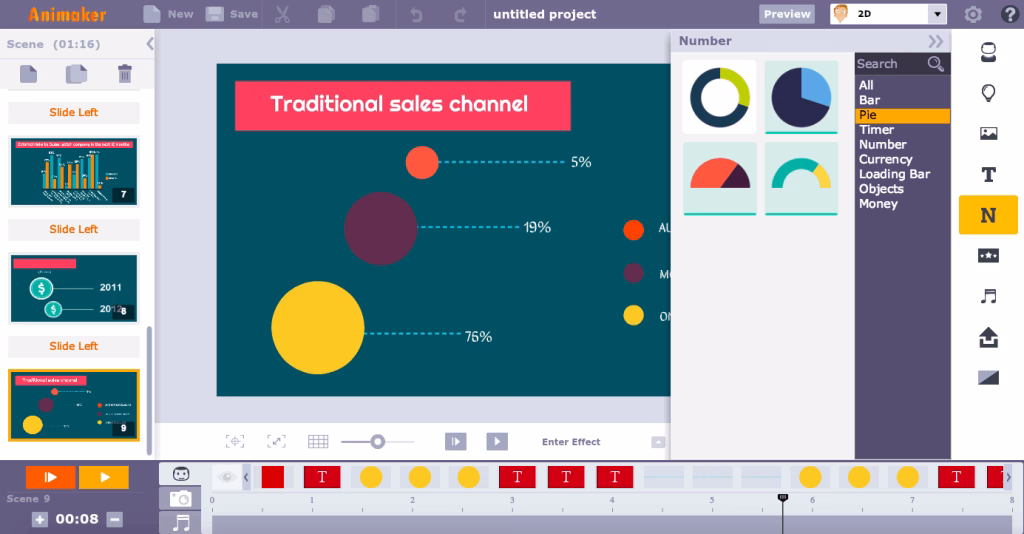
Main Features
- Pre-Designed Animated Characters & Visual Assets: Hundreds of customizable characters, scenes, icons, illustrations, and animations that bring your infographics to life.
- Animated Data Visualization: Basic charts, graphs, and diagrams that can be animated to reveal data over time, with hover effects and smooth transitions.
- Text & Animation Options: Fully customizable fonts, sizes, colors, and pre-built text animations for maximum visual impact.
- Built-in Voiceover & Audio Tools: Record professional voiceovers, add background music and sound effects, and perfectly sync audio with your animations.
- Videographics & Animated Infographic Templates: Ready-made dynamic templates for infographics, explainer videos, and presentations that you can customize in minutes.
- Export & Sharing: Download as MP4, GIF, PNG, JPG, PPT, PDF, or SVG, or upload directly to YouTube and Facebook.
- Real-Time Collaboration: Team editing features in higher plans for seamless group projects.
- Scene-Based Editing Workflow: Build infographics step-by-step using scenes, similar to video editing timelines.
Advantages
- Motion, characters, and voiceovers make your infographics far more captivating than static designs.
- Create full explainer videos and animated infographics without needing separate tools.
- Pre-built templates and audio tools speed up production of professional-looking results.
- Animated infographics perform exceptionally well on social media, websites, and presentations.
- No prior video editing experience required, yet you get studio-quality output.
Limitations of Animaker
- Fewer templates, characters, and audio options compared to larger design platforms, which may restrict uniqueness for advanced users.
- Best suited for animated formats; less ideal for purely static or highly data-heavy interactive dashboards.
- While easy to start, mastering timing, syncing, and complex scenes takes some practice (about 45 minutes for a basic project).
- Limited to SD quality and fewer assets; advanced features like 4K export and team collaboration require paid plans.
- Basic charts only; for complex live data connections, specialized tools may be better.
Pricing
- Free Plan – Limited features with standard-definition exports
- Basic Plan – Around $15/month (HD videos, more assets)
- Starter Plan – Around $25/month (Full HD, more export options)
- Pro Plan – Around $43/month (4K quality, team collaboration)
- Enterprise Plan – Custom pricing
Why Choose Animaker?
Animaker is the leading animated infographic maker that bridges design and video creation in one platform. Unlike static tools, it specializes in adding professional animation, characters, voiceovers, and motion graphics that turn ordinary infographics into dynamic, story-driven video content that boosts engagement and retention.
Its focus on “videographics” makes it uniquely powerful for explainer-style infographics and marketing videos.
Snappa – Fast & Easy Infographic Maker for Social Media and Quick Designs
Snappa is a lightweight, user-friendly infographic generator and graphic design tool that makes it incredibly simple to make infographics online, social media graphics, blog visuals, and marketing content in minutes.
Designed with non-designers in mind, Snappa is an efficient infographic generator with thousands of ready-made templates, high-quality stock photos, vectors, and shapes, perfect for busy marketers, bloggers, and small businesses who need professional-looking results without the complexity or steep learning curves.
Its fast workflow and social media focus make Snappa one of the quickest ways to produce eye-catching infographics that perform well online.
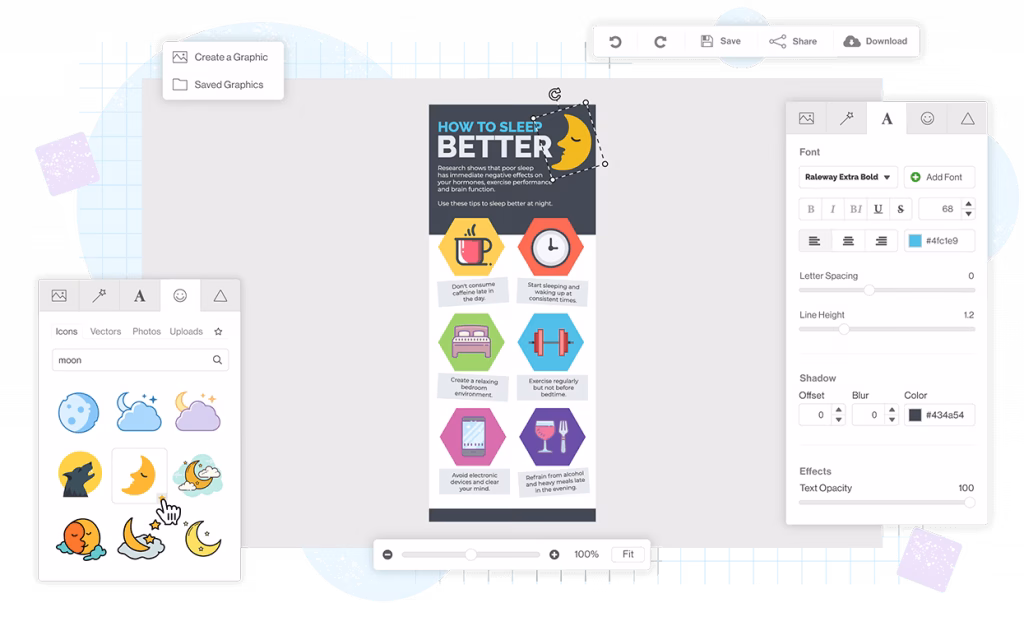
Main Features
- Huge Library of Templates & Visual Assets: Access thousands of beautiful templates, high-resolution stock photos, vectors, icons, shapes, and fun elements (including blobs and sketch lines).
- Smart Resize Tool: Instantly resize and adapt your infographics for different platforms (Instagram, Pinterest, Facebook, etc.) with automatic element repositioning.
- Background Remover: Easily remove image backgrounds to create clean cutouts for your designs.
- Text & Customization: Simple yet effective text editing with full control over fonts, colors, and styles.
- Buffer Integration: Schedule and share your infographics directly on social media platforms like Pinterest.
- Drag-and-Drop Editor: Intuitive interface that lets even complete beginners create polished graphics quickly.
Advantages
- Most users can finish a professional infographic in just 15 minutes.
- Clean, uncluttered interface with no overwhelming options. Ideal for non-designers.
- Full access to all templates and assets; only download limits apply on the free tier.
- Built-in resizing and Buffer integration make sharing infographics effortless.
- Colorful, cheerful designs that appeal to modern audiences, bloggers, and younger demographics.
- Feature-rich even without paying, saving time and money for small teams.
Limitations of Snappa
- Lacks charts, graphs, or tools for data-rich infographics. Best for simple informational or list-style designs.
- Fewer pre-designed text blocks, animations, or interactivity compared to more advanced tools.
- Exports are image-only; no support for interactive HTML, SCORM, or animated elements.
- No dedicated desktop or mobile app. Everything runs in the browser.
- Not ideal for highly detailed, professional, or data-heavy infographics.
Pricing
- Free Plan – Access to all templates and assets with limited monthly downloads
- Pro Plan – Around $10/month (unlimited downloads + Buffer integration)
- Team Plan – Around $20/month (basic team features and shared access)
Why Choose Snappa?
Snappa stands out for one reason: it removes friction.
Most infographic tools try to do everything. Snappa doesn’t. It keeps things simple, fast, and focused. You won’t find advanced analytics tools or complex animations here, but you will get a smooth workflow that helps you publish visuals quickly.
For many users, especially those managing content regularly, that trade-off actually works better.
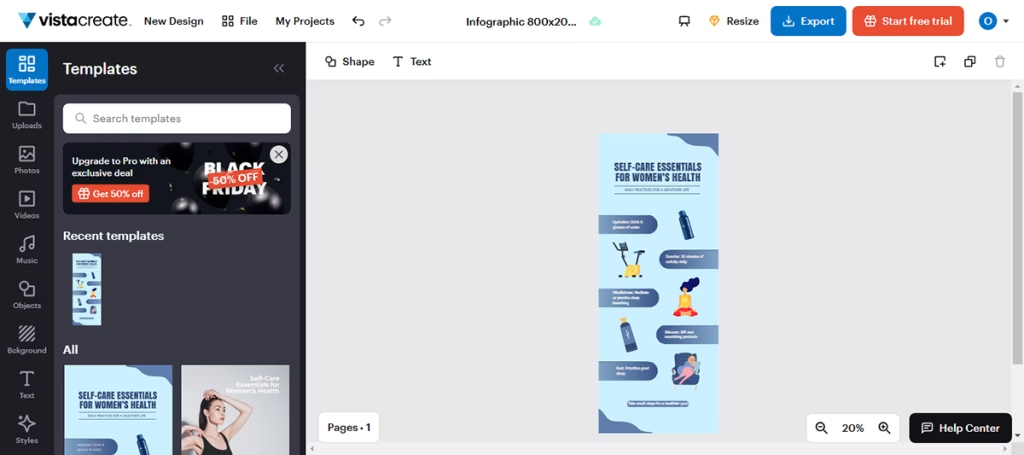
VistaCreate Infographic Maker – Best for Creative & Animated Infographics
VistaCreate (formerly Crello) is a free online infographic creator and graphic design platform that combines a powerful AI image generator with thousands of customizable infographic templates. It serves as an excellent infographic generator for creating vibrant, animated, and brand-consistent visuals with minimal effort.
Whether you’re designing for social media, marketing campaigns, education, or business presentations, VistaCreate makes it easy to produce professional infographics using its drag-and-drop editor, rich asset library, and smart animation features.
Main Features
- AI Image Generator: Turn text prompts into photorealistic, artistic, or 3D images to incorporate directly into your infographics.
- Thousands of Infographic Templates: Diverse templates for marketing, education, reports, and more, with easy customization options.
- Visual Assets: Extensive library of icons, illustrations, images, vector elements, and 13,000+ animated stickers and design objects.
- Animation & Effects: Add engaging animations to text, images, and objects to make your infographics more dynamic and eye-catching.
- Brand Kit: Upload logos, fonts, colors, and media for consistent branding across all designs (auto-generates from your website URL).
- Charts & Data Visualization: Basic charts and graphs to present data effectively within infographics.
- Team Collaboration: Real-time collaboration with up to 10 team members (Pro plan).
- Smart Resize Tool: Instantly adapt infographics for different social media platforms or custom dimensions.
- Text & Font Customization: Wide variety of fonts, including options for minimalist, maximalist, or your own uploaded brand fonts.
Advantages
- Animated objects and effects help your infographics stand out and engage viewers.
- The Brand Kit makes it simple to maintain professional, on-brand visuals across projects.
- Generate custom images from text prompts to enhance or fill gaps in your infographic designs.
- Easy resizing and vibrant templates optimized for platforms like Instagram, Facebook, and more.
- Simple UI and pre-designed templates allow quick creation even for non-designers.
- Real-time team editing at a reasonable price point.
Limitations of VistaCreate
- Limited chart options and no advanced interactivity (hover effects, live data imports) compared to specialized tools.
- Animations are often fixed in style and motion, with less flexibility than advanced platforms.
- Relies on templates and manual customization rather than full AI-driven infographic creation from prompts.
- Requires a credit card for trial access in some cases.
- Lacks in-depth engagement analytics or specialized export formats like SCORM/xAPI.
Pricing
- Free Plan – Access to thousands of templates and basic design tools
- Pro Plan – Around $10/month (billed annually) or $13/month
- Enterprise Plan – Custom pricing with advanced collaboration and support
Why Choose VistaCreate?
VistaCreate stands out because it combines AI image generation with infographic design.
While many tools focus purely on data or static designs, VistaCreate emphasizes visual appeal, motion, and branding, which makes it ideal for users who want vibrant, engaging infographics that align perfectly with their brand identity without requiring advanced design skills.
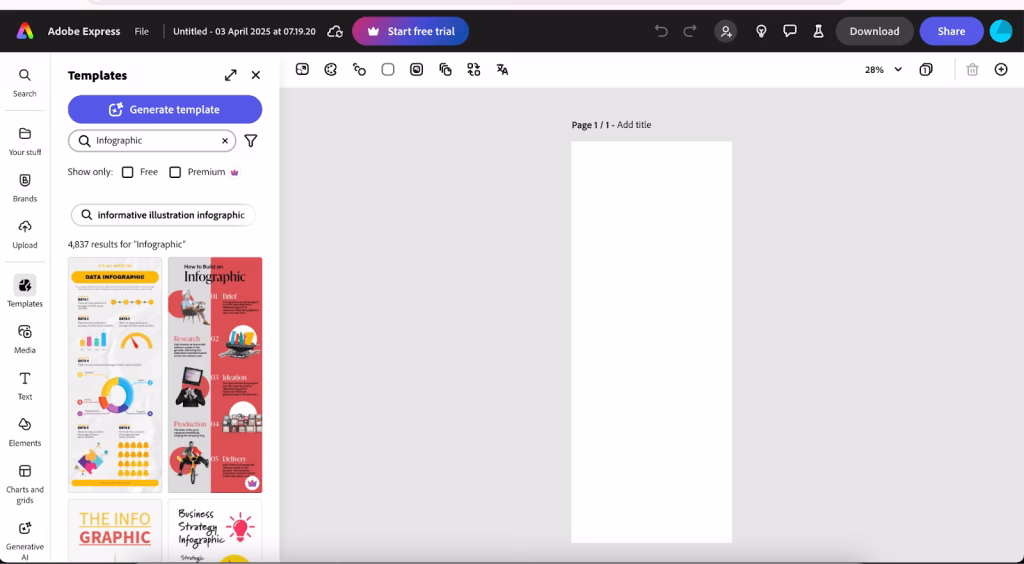
Adobe Express: AI Infographic Maker with Professional Design
Adobe Express is a modern AI infographic maker with Creative Cloud integration. It’s designed for users who want visually polished infographics without having to use complex design software like Photoshop or Illustrator.
One thing that stands out right away is how structured the editor feels. Every element sits within a clean column layout, making editing straightforward. You don’t have to deal with overlapping layers or messy alignment issues, which usually slow things down in other tools.
On top of that, its AI “Generate Template” feature lets you turn simple text prompts into ready-made infographic designs. That alone can cut down a lot of design time, especially when starting from scratch.
Main Features
- Convert simple text prompts into complete infographic designs instantly.
- Thousands of high-quality, pre-designed templates for infographics, social media posts, reports, and presentations.
- Easy customization with elements arranged in a clean column layout, no overlapping issues or manual locking/unlocking needed.
- Add visual effects and individual animations to text, images, and icons for engaging results.
- Maintain professional brand identity with colors, fonts, logos, and enterprise-grade controls.
- Simple workflow with Photoshop, Illustrator, and other Adobe apps for advanced editing when needed.
- Directly publish infographics to social platforms and integrate with cloud storage.
Advantages
- Generate templates and get smart design suggestions to speed up the creation process significantly.
- Premium templates and effects deliver polished, high-end infographics every time.
- Simple drag-and-drop editing with no steep learning curve.
- Perfect for users already working with Photoshop, Illustrator, or Creative Cloud.
- Built-in tools ensure consistent branding across all your visuals.
- Publish directly to social media without leaving the platform.
Limitations
- The 30-day free trial asks for payment details, which can be inconvenient.
- Better suited for visual storytelling than complex, interactive charts or live data imports.
- Lacks deep hover effects or highly interactive elements compared to specialized data tools.
- Users outside the Adobe world may find other standalone tools simpler or more affordable.
- Advanced branding and full template access are available only on a paid plan.
Pricing
- Free Plan – Limited access to templates and features
- Premium Plan – Starts at $9.99/month
- Enterprise Plans – Custom pricing for teams and organizations
- Free Trial – 30 days (requires payment details)
Why Choose Adobe Express?
Adobe Express sits in an interesting position. It’s not as complex as Photoshop, but it still carries that Adobe-level design quality.
The real advantage comes from combining AI with structure. You’re not just editing templates; you’re generating them, refining them, and aligning them with your brand in one place.
For teams already using Adobe products, this becomes less of a tool and more of an extension of their workflow.
Genially: Interactive Animated Infographic Maker for Engagement
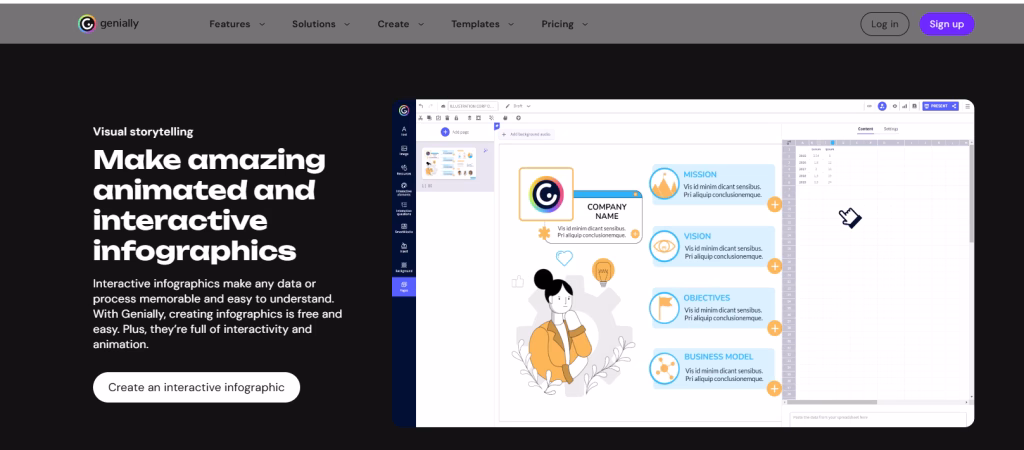
Genially is an interactive infographic maker online built for engagement. Instead of static visuals, it focuses on clickable, animated, and media-rich infographics that users can explore.
This tool feels a bit different from others. It’s not just about designing something that looks good. It’s about making something people can interact with. You can add tooltips, pop-ups, audio, and even embedded videos directly into your infographic.
The result is more like a mini experience than a simple visual. That makes it especially useful for presentations, reports, and educational content where interaction actually adds value.
Main Features
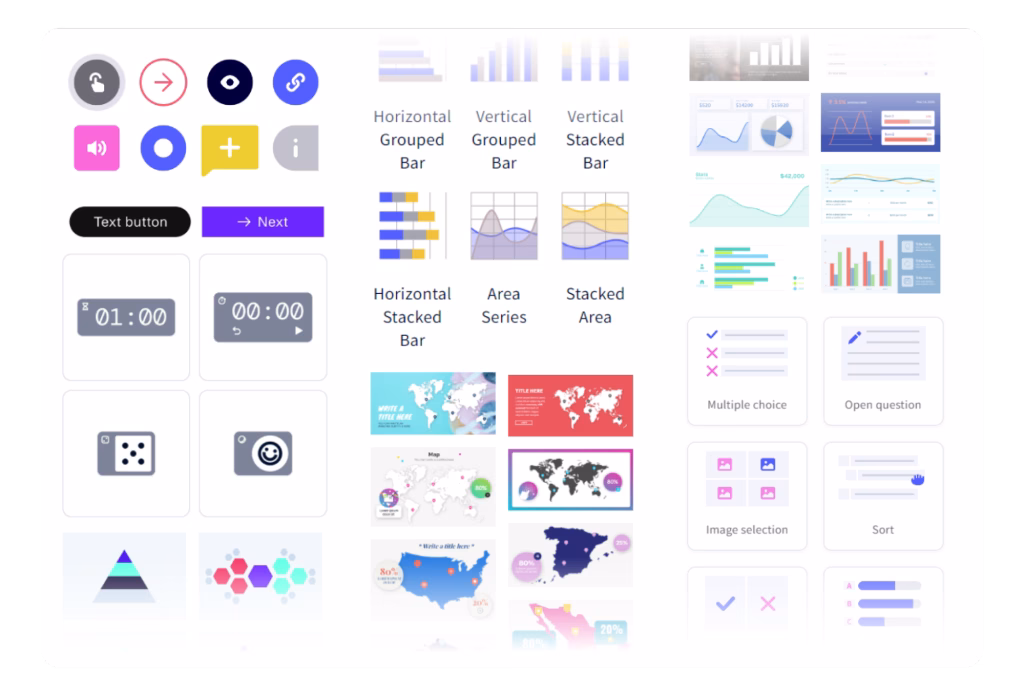
- Interactive Elements: Add hotspots, tooltips, pop-up windows, CTA buttons, links, and triggers (including sound on click) to make infographics fully interactive.
- Animations & Motion Effects: Apply fades, zooms, slides, and transitions to text, icons, charts, and other elements for lively animated infographics.
- Smartblocks & Pre-designed Assets: Quick-build animated and static blocks that combine text, images, and content for faster creation.
- Data Visualization: 15+ customizable charts, maps, and diagrams to present data effectively.
- Rich Visual Resources: Icons, shapes, illustrations, scenes, silhouettes, stickers, and embed options for YouTube/Vimeo videos and audio.
- AI Text Editing & Rewriting: Built-in AI to refine and improve text content within your designs.
- Brand Kit: Upload logos, fonts, and colors for consistent branding.
- Activity Analytics: Track how viewers engage with your interactive infographics (available on Pro plans).
- Diagramming Tools: Map out ideas and concepts directly in your projects.
- Export & Sharing: Share as public links or download as HTML (interactive version); JPG download is available on paid plans.
Advantages
- Turn infographics into clickable experiences with tooltips, hotspots, audio, and video embeds.
- Bring designs to life with smooth motion effects and animated elements.
- Create and share interactive infographics for free (public links).
- Smartblocks and pre-designed resources speed up the design process.
- Understand viewer engagement with built-in activity tracking.
- Separate categories for vertical and horizontal infographic templates.
Limitations
- A smaller selection of ready-made infographic templates compared to other tools.
- Only 15+ charts and maps; less depth than data-focused platforms.
- No desktop or mobile apps; everything runs in the browser.
- JPG exports and advanced features are available only on a paid plan.
- Some illustrations and animations have fixed styles with less flexibility.
- Co-editing is available but less reliable than full real-time workflows on other platforms.
Pricing
- Free Plan – Full creation access, but export is limited to shareable links
- Pro Plan – Around $10/month
- Master Plan – Around $20/month
- Author Plan – Around $35/month
Why Choose Genially?
Genially shifts the focus from “design” to “interaction.” Instead of asking how your infographic looks, it asks how it behaves. Can users click it? Explore it? Learn from it step by step? That small shift changes everything. It turns a passive infographic into something more engaging, especially when attention spans are short.
DesignCap Infographic Maker – Best for Statistical & Data-Driven Infographics
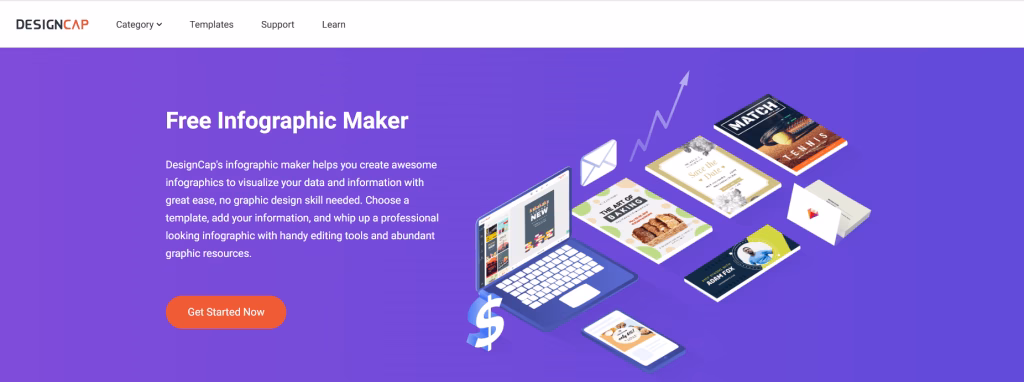
DesignCap is a data-focused infographic maker software designed to create clean, structured, and presentation-ready visuals. It’s especially useful when the goal is to turn numbers into something readable without spending hours designing from scratch.
The platform leans toward statistical infographics, KPI dashboards, and business reports. Templates come pre-structured, so instead of building layouts manually, you mostly adjust content and visuals.
One thing that stands out is its simplicity. It doesn’t try to overwhelm with too many features. You get just enough tools to create solid, professional infographics, particularly for reports and analytics.
Main Features
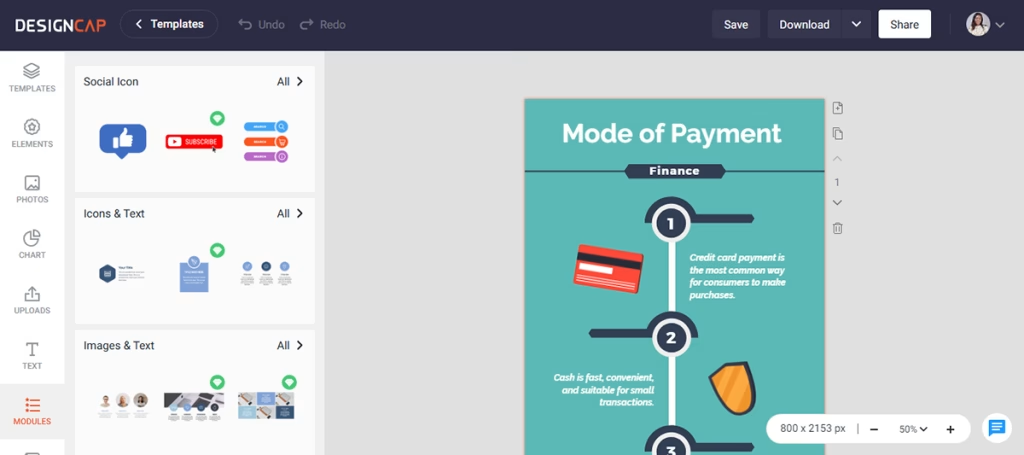
- Modular Template System: Unique “Modules” feature lets you build custom templates using pre-arranged groups like image+text, icons+text, timelines, steps, shapes, and statistics blocks.
- Professional Infographic Templates: Extensive library of clean, editable templates optimized for business reports, financial visuals, healthcare, education, and social media.
- Data Visualization Tools: Easy-to-use charts, graphs, and metrics elements for statistical storytelling and KPI presentation.
- Visual Assets: Collection of images, icons, and graphical elements that can be resized and recolored.
- Text Customization: Flexible text editor with various fonts, sizes, colors, and pre-designed text blocks for well-aligned, readable content.
- User-Friendly Editor: Shallow learning curve with a clean interface designed for non-designers and beginners.
- Export Options: Download as high-resolution PNG, JPG, and PDF (available with higher plans).
Advantages
- Strong focus on data-driven infographic design
- Clean, professional templates for reports and presentations
- Very easy to use with a minimal learning curve
- Affordable pricing for startups and small teams
- Modules feature speeds up layout creation
- Good for KPI dashboards and performance visuals
Limitations
- No interactivity or animation features
- Limited data import options (no direct Excel/CSV integration)
- The visual asset library is smaller than the competitors
- Export formats are limited to JPG and PNG
- No mobile or desktop app (browser-only tool)
- Not suitable for highly creative or animated designs
Pricing
- Free Plan – Limited templates, up to 5 saved designs
- Basic Plan – $4.99/month (100 designs + high-res exports)
- Plus Plan – $5.99/month (up to 1000 designs + priority support)
Why Choose DesignCap?
DesignCap focuses on clarity over creativity.
While many tools try to balance design, animation, and interactivity, DesignCap stays centered on structured, data-first infographics. The Modules feature plays a big role here. Instead of designing layouts from scratch, you assemble them using ready-made sections.
This makes it practical for users who regularly handle reports and need something consistent, not overly flashy.
Wrapping It Up
At the end of the day, it’s less about finding the “perfect” infographic design tool and more about finding the one that feels right to use.
Some tools are fast and simple. Others give you more control but take a bit more time. It really depends on what you’re creating and how you like to work.
If you’re just starting, go with something easy like Canva or Snappa. If you are dealing with reports or data, online infographic tools like Visme or Infogram will make your life easier.
The easiest way to decide? Try one. Spend 10–15 minutes inside it. You’ll know pretty quickly whether it works for you.